Grade Curve Calculator: Bell Curve, Linear & Custom Scaling
A free, easy-to-use tool for educators to calculate and apply grade curves using multiple methods. Adjust student grades fairly and efficiently with instant statistical analysis.
Enter Grades
Enter grades separated by commas, spaces, or new lines
Upload a CSV file with grades (one grade per row)
Curve Method
Grade Curve Methods Explained
This section explains the most commonly used grade curving methods in education. Each method adjusts student scores in a different way depending on exam difficulty, class performance, and grading goals. Use this overview to understand how each curve works before applying it in the calculator above.
Quick Method Overview
Bell Curve (Normal Distribution)
Distributes grades according to statistical normal distribution.
Learn More →Custom Normal Distribution
Creates custom bell curve with specified mean and deviation.
Learn More →Jump to: Bell Curve | Linear Adjustment | Percentage Boost | Flat Scale | Square Root | Highest = 100% | Custom Normal | Grade Boundaries
Bell Curve Grade Calculator (Normal Distribution)
What it is: A bell curve grade calculator redistributes student scores using statistical normal distribution to standardize class performance.
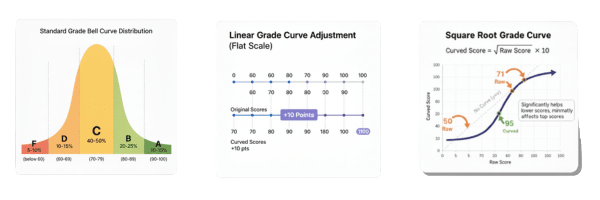
Bell curve grading, also known as normal distribution grading, is a statistical method that distributes student grades according to a predetermined curve. This method assumes that student performance naturally follows a bell-shaped distribution, where most students perform at an average level, with fewer students achieving very high or very low scores.
In a typical bell curve system, approximately 68% of students receive grades in the middle range (C grades), while 14% receive higher grades (B grades) and 14% receive lower grades (D grades). Only about 2% of students receive the highest grades (A grades) and 2% receive failing grades (F grades). This method is particularly useful when you want to standardize grades across different sections of the same course or when dealing with unusually high or low class averages. However, educators should consider the fairness implications, as this method can artificially limit the number of high achievers regardless of actual student performance.
Linear Grade Adjustment Calculator
What it is: A linear grade adjustment calculator shifts all grades by the same number of points to reach a target class average.
Linear grade adjustment is a proportional scaling method that shifts all student grades by the same amount to achieve a target class average. Unlike percentage-based methods, linear adjustment maintains the relative differences between student scores while moving the entire grade distribution up or down to reach a desired mean.
This method works by calculating the difference between the current class average and your target average, then adding or subtracting that difference from every student's grade. For example, if your class average is 72% and you want it to be 80%, you would add 8 points to every grade. Linear adjustment is preferred over bell curve methods when you want to maintain the original grade distribution shape while simply adjusting for test difficulty.
Percentage Boost Grade Calculator
What it is: A percentage boost grade calculator increases each score by a fixed percentage rather than a flat number of points.
Percentage boost grading increases all student scores by a fixed percentage of their original grade, rather than adding a flat number of points. This method provides proportionally larger increases to students with higher initial scores, which can help maintain performance distinctions while providing meaningful improvement across all grade levels.
For example, applying a 10% boost to a student with an 80% grade results in an 88% final grade (80 + 8 points), while a student with a 60% grade receives a 66% final grade (60 + 6 points). This method is commonly used when instructors want to provide grade relief while preserving the relative achievement gaps between high and low performers.
Flat Scale Grade Addition (Add Points to All Grades)
What it is: Flat scale grade addition adds the same fixed number of points to every student’s score.
Flat scale addition is the simplest grade curving method, involving adding a fixed number of points to every student's grade. This straightforward approach provides equal benefit to all students regardless of their initial performance level, making it an equitable method for adjusting grades when an assessment proves more difficult than intended.
This method is particularly effective when you can identify specific questions or concepts that were poorly taught, unfairly difficult, or contained errors. Flat scale addition maintains the original grade distribution shape and relative student rankings while shifting the entire curve upward.
Square Root Grade Scaling Calculator
What it is: A square root grade scaling calculator applies non-linear scaling to significantly boost lower scores while minimally affecting higher scores.
Square root scaling is a non-linear grading method that applies the mathematical square root function to transform grades, providing disproportionately larger improvements to lower scores while maintaining higher scores relatively unchanged. This method is particularly beneficial for struggling students while preserving the achievements of high performers.
The square root curve works by taking the square root of each grade (as a percentage) and then scaling it back to a 0–100 range. This creates a curve that significantly helps students in the lower grade ranges while providing modest improvements to those already performing well.
Highest Grade Set to 100% Grade Curve
What it is: This grade curve rescales all scores so the highest-performing student receives a perfect 100%.
The highest grade as 100% method scales all student grades proportionally so that the top performer in the class receives a perfect score of 100%. This approach maintains the relative performance differences between students while ensuring that at least one student achieves the maximum possible grade.
This scaling method works by dividing every student's grade by the highest grade in the class, then multiplying by 100. It is particularly useful when an assessment proves more difficult than anticipated.
Custom Normal Distribution Grade Calculator
What it is: A custom normal distribution calculator lets educators set their own mean and standard deviation for grade curving.
Custom normal distribution grading allows educators to create a bell curve with specifically chosen mean and standard deviation values, providing precise control over the final grade distribution. Unlike standard bell curve methods with fixed percentages, this approach lets instructors tailor the curve to match their specific grading philosophy and course expectations.
This method transforms the original grade distribution into a new normal distribution using statistical z-scores, making it ideal for standardizing grades across multiple sections or institutions.
Custom Grade Boundaries Calculator
What it is: A custom grade boundaries calculator defines letter grades using instructor-selected score thresholds instead of mathematical curves.
Custom grade boundaries allow instructors to set specific numerical thresholds for letter grades (A, B, C, D, F) rather than applying mathematical curves to the scores themselves. This method provides direct control over grading standards while preserving original numeric scores.
This approach is particularly useful when aligning grading policies with departmental rules, accreditation requirements, or course-specific learning outcomes.
Best Practices for Applying Grade Curves
Applying a grade curve effectively requires balancing fairness, transparency, and academic integrity. The goal is not simply to raise scores, but to ensure grades accurately reflect student understanding and assessment difficulty.
- Match the curve to the exam difficulty : Use stronger curves (such as square root or highest = 100%) only when exams are demonstrably difficult, not as a default grading strategy.
- Analyze score distribution before curving : Always review the mean, median, and spread of grades to understand whether a curve is truly needed and which method is most appropriate.
- Preserve relative student performance : Choose curving methods that maintain meaningful score differences between students unless standardization is explicitly required.
- Apply curves consistently and transparently : Clearly document the curving method used and apply it uniformly across all students to avoid perceptions of bias or unfairness.
- Align with institutional grading policies : Ensure the selected curve method complies with department or university guidelines to maintain academic credibility.
Related Calculators
Explore these other helpful tools for educators and students:
-
GPA Calculator
Calculate your Grade Point Average with weighted and unweighted options for accurate academic tracking.
-
Final Grade Calculator
Determine what score you need on your final exam to achieve your desired course grade.
-
Grade Percentage Calculator
Convert between letter grades, percentages, and GPA points with customizable grading scales.
-
Assignment Grade Calculator
Calculate weighted assignment grades and track your progress throughout the semester.
-
Test Score Calculator
Quickly calculate test scores, percentages, and determine how many questions you got right or wrong.
-
Grade Needed to Pass Calculator
Calculate the minimum score required to pass a course or exam based on your current grades and grading criteria.
How Does a Grade Curve Calculator Work?
Grade Curve Calculators need some important details like the highest score, the way you want to do the grade curve, and the raw scores. Teachers have to put in this info for the calculator. After that, the calculator works out the adjusted grades. It shows all the steps, so you can see how it gets the results.
One thing that makes it stand out is how it uses formulas. For example, it can use standard deviation or change scores by a set number. These tools help teachers get new grade lists and results for assignments. This way of working helps give all students fair grades, and teachers can use their time better in the classroom.
Data inputs (raw scores, max score, curve method).
The best way to use a grade curve calculator is to start by entering the correct numbers. You have to add the raw scores for each student. These numbers show how each student did on the test or assignment. Also, do not forget to put in the maximum score. The maximum score lets people see how everyone did compared to others, so you get a simple look at relative performance with the calculator.
When you pick a grade curve method, such as a bell curve or just a simple line, you decide how the current student grades will change. The grade curve you choose with the calculator matters a lot. It changes the way new values are given to the student grades. By putting these things together, you help make a fair system so that everyone gets a grade that fits well in the academic setting.
Algorithms behind curving (e.g., standard deviation, normalization).
Algorithms play a big part in grade curving. They help teachers change student scores in ways that are fair and good for everyone. A lot of teachers use something called the standard deviation. This shows how much the scores go up or down from the average score. By doing this, they can make a bell curve and see how the whole class did. Normalization is another method. It changes raw scores into a standard form. This makes it easy to look at results from different tests or classes the same way.
These kinds of grade curving methods create new values. They help the grading system be more right. Also, these changes help make more equitable evaluations for every student. Grade curving works so that all people in the class get the fairest grades they can.
Outputs: new score distributions, grade assignments, reports.
The grade curve calculator brings some good changes to grading. The calculator helps show new values for scores. These new values happen because of the way the curving works. It helps give a fair look at student performance. Grades are updated so they can match these new values. This makes it easier to see how each student is doing in grading with the calculator and the curving.
In the end, the calculator gives reports that show how student scores have changed. It also explains the way the grade curve was used. This lets everyone see how the grading was done and makes things clear for both teachers and students. When there is a grade curve, it is much easier for teachers to talk with students about the changes.
Tips for Educators Using Grade Curve Calculators
Knowing when to use a grade curve calculator can help make grading more fair. You may use this tool when the test scores are much lower than you thought they would be. You can also use it if some tests seem harder than others. It is good to look at old grades and the distribution of scores to see what the department wants. A calculator can help you and others get better results in grading.
To be fair to all, do not use curving in every situation. Keep the grading the same way as much as you can so that adjusted grades are given out the right way. Always follow the rules so students get equitable evaluations. Also, tell students how you use curving and the calculator. This will help them understand the process and trust it. When you do this, people know what goes into curving and how their new grades are set.
I. What Inputs Do You Need for the Calculator?
To use a grade curve calculator, first gather all the raw scores. You can make a list of these scores or save them as a CSV file. Next, write down the total points possible for the test or the assignment. Then, pick the curve type that you want to use, such as bell, linear, or the one that works with standard deviation. If you need to, you can also put in a target mean or the median score.
II. What Steps Should You Follow to Calculate Curved Grades?
To figure out curved grades, first get all the student information you need. After that, you have to pick the best curving way that fits your needs. Then, put the data into the calculator. Once you do this, take a look at the score distribution you get. In the end, use or export the adjusted grades in any way you want.
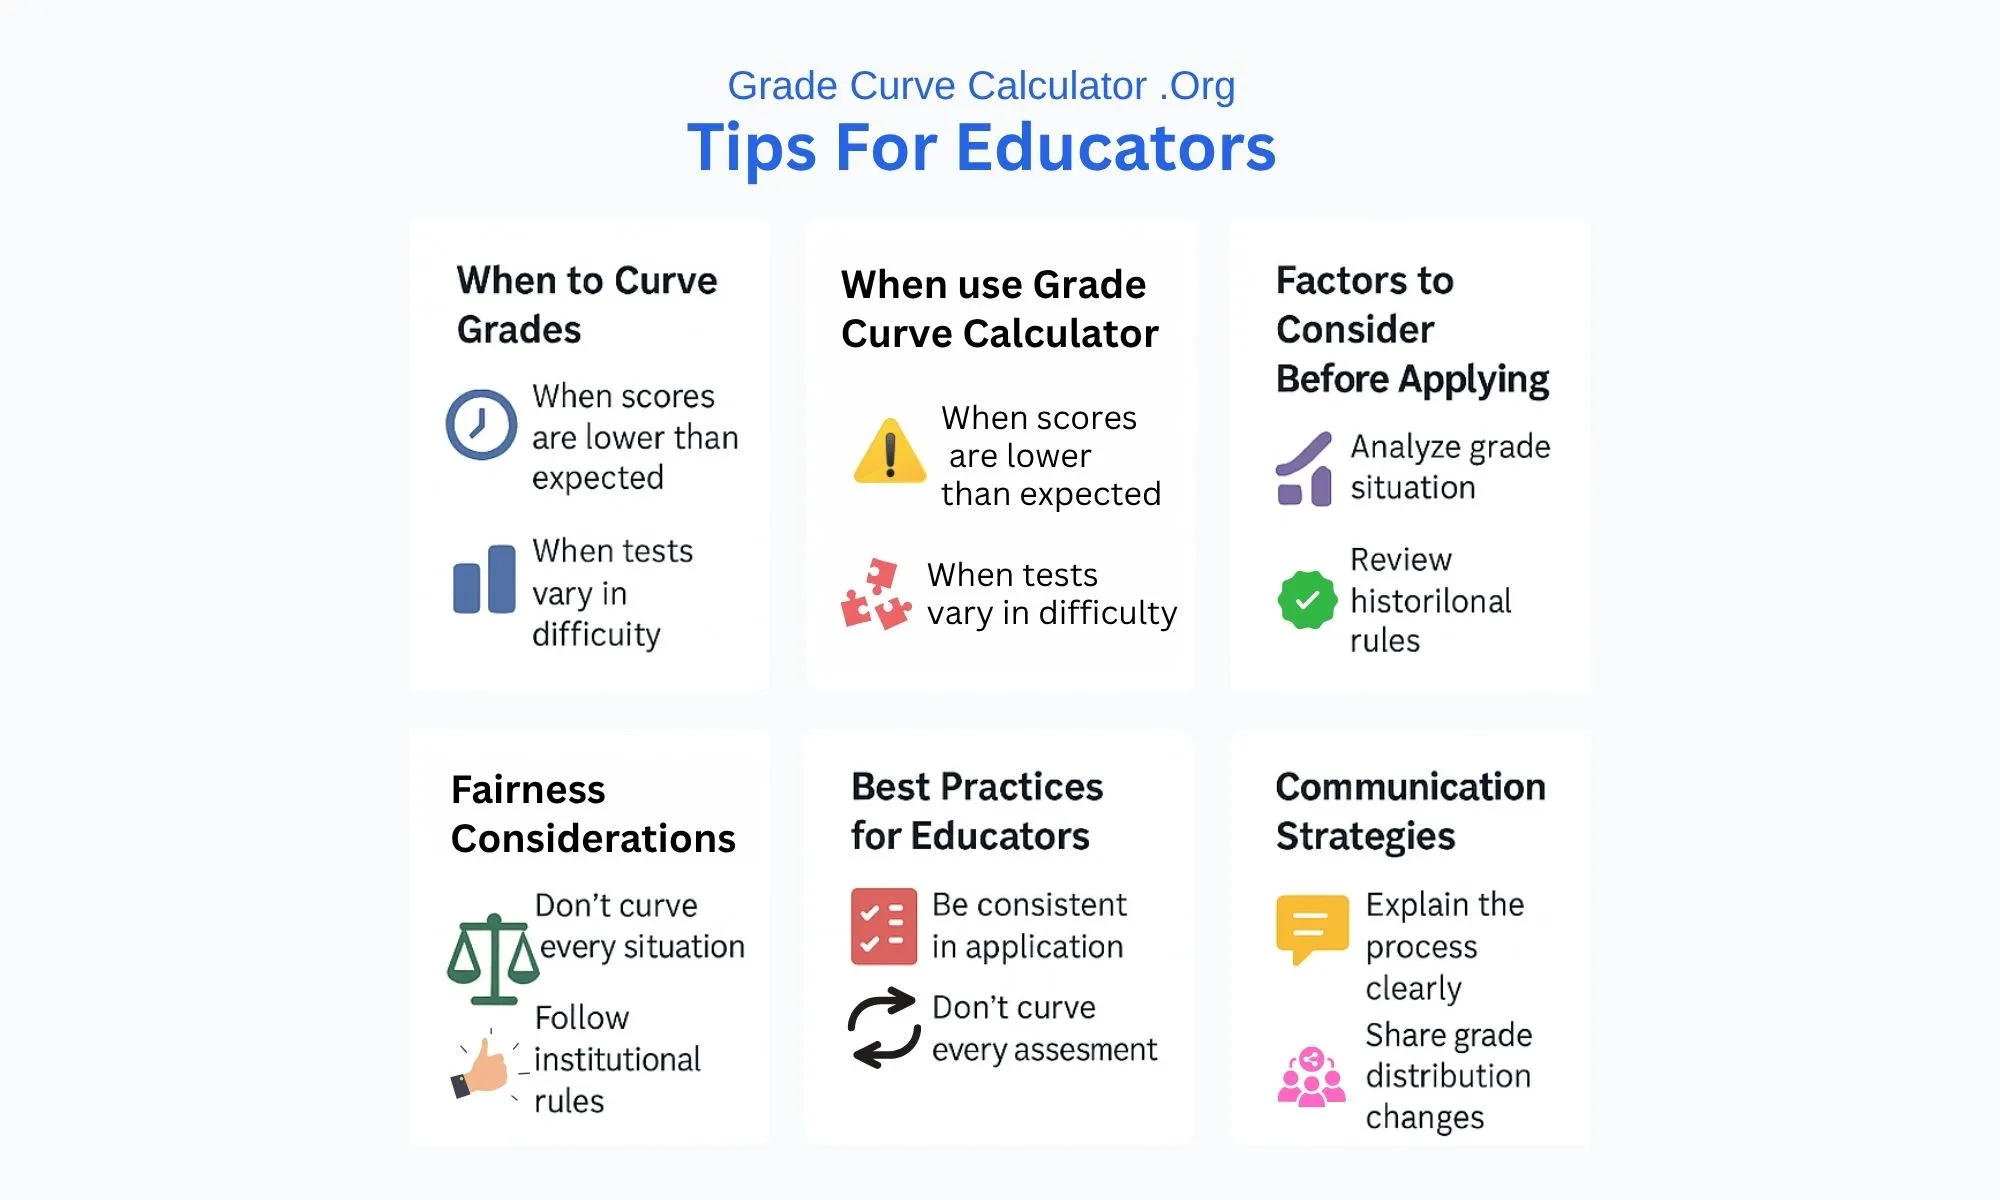
Tips For Educators From GradeCurveCalculator.org
Benefits of Using a Grade Curve Calculator
Using a grade curve calculator can make grading fair for everyone. The tool gives one clear way to adjust scores for all students. A calculator also shows how the class is doing as a whole. This helps grades line up with what the school or college wants. Because of this, people feel more sure that the grades are right. In the end, this way of grading helps students have a better time as they learn.
- Ensures fairness by adjusting scores objectively, especially for difficult tests or tricky exams.
- Supports transparency by following a clear grading method everyone can understand.
- Reflects true understanding by aligning grades more closely with what students actually know.
- Reveals performance trends by showing patterns in student strengths and weaknesses.
- Improves teaching strategies through insights gained from class-wide performance data.
- Aligns with institutional standards by helping grades meet school or department expectations.
- Builds trust in grading by using consistent methods like normalization or standard deviation.
- Boosts student confidence by making grading clear, fair, and easy to justify.
Frequently Asked Questions
🎯 Quick Answer
A Grade Curve Calculator adjusts student scores based on class performance using methods like bell curve, linear adjustment, or square root scaling. It ensures fair grading when exams are difficult or scores need standardization across sections.
What does "grading on a curve" mean?
"Grading on a curve" means adjusting student scores based on overall class performance rather than fixed, absolute percentage thresholds. If an entire class struggles on a difficult exam, the curve raises grades to reflect true understanding relative to their peers. This ensures fairness when assessments don't accurately measure learning.
What is a Grade Curve Calculator and how does it work?
A Grade Curve Calculator is an online tool designed to adjust student scores to ensure fairness and consistency. Our calculator automates complex curving methods—such as the Bell Curve, Linear Adjustment, and Square Root scaling—allowing teachers to visualize and apply new grade boundaries instantly without manual calculations.
How do you calculate a curved grade? (Step-by-step formula)
To manually calculate the simplest curved grade (Linear Adjustment), you follow these steps:
- Find the class average (mean score).
- Determine your target average (e.g., 75% or 80%).
- Calculate the difference: Target Average - Current Average.
- Add this difference (Flat Scale points) to each student's score.
Example: If the class average is 65 and you want it to be 75, add 10 points to every score. A grade curve calculator automates this process for all 8 curving methods instantly.
What is the formula for a bell curve grade?
A bell curve (or normal distribution) uses z-scores and standard deviation to normalize grades:
Our grade curve calculator applies this complex formula automatically to ensure accurate normal distribution.
Can you curve grades in Excel?
Yes, but it is time-consuming and prone to manual errors. You must:
- Calculate the class mean using =AVERAGE().
- Find the standard deviation using =STDEV().
- Manually apply the specific curving formulas for each curve type.
A grade curve calculator simplifies this entire process—just input scores and select your preferred method. Our tool also provides instant visualizations and export options that would require significant setup to replicate in Excel—no spreadsheet formulas required.
What is the difference between linear and bell curve grading?
Linear Adjustment (or Flat Scale): Adds or subtracts the same fixed number of points from all scores, which maintains the original score gaps between students.
Bell Curve Grading: Redistributes scores into a normal pattern. This process is statistical and can shift the relative rankings and score gaps between students to achieve the target distribution.
Use our grade curve calculator to compare both methods instantly.
Can a curve hurt your grade?
In most cases, no—especially with methods like Square Root, Percentage Boost, or Linear Adjustment, which only increase scores. However, with strict Bell Curve grading that forces a fixed distribution (e.g., only 15% can get A's), high-performing students in a strong class might receive lower letter grades than they would without curving. Our Grade Curve Calculator shows you the impact before applying changes, so you can review and adjust the method if needed.
How does the "Highest = 100%" feature work?
This feature identifies the highest raw score in your dataset and sets it as the new benchmark. The Grade Curve Calculator then rescales every other student's grade proportionally relative to that top score.
How much can a curve help your grade?
The grade improvement depends heavily on the curve method and overall class performance:
- Linear/Flat Scale: Typically adds +5 to +15 points for everyone equally.
- Square Root: Can add +10 to +21 points for lower scores (e.g., a 50 becomes 71), while only adding +3 to +5 points for high scores (e.g., a 90 becomes 95).
- Highest = 100%: Variable, but can add +5 to +20 points if the top score was significantly low.
- Bell Curve: Depends on your relative position—could increase OR decrease grades based on where the target distribution places you.
Use our Grade Curve Calculator to simulate different methods and see exactly how each would affect specific scores before applying changes.
What is the standard bell curve grade distribution?
The standard bell curve defines letter grades based on the percentage of students who fall within a certain range of the mean (average). The typical distribution aims for the following grade percentages:
- A grades: Top 10-15% of students (typically 90-100)
- B grades: Next 20-25% of students (typically 80-89)
- C grades: Middle 40-50% of students (typically 70-79)
- D grades: Next 10-15% of students (typically 60-69)
- F grades: Bottom 5-10% of students (below 60)
However, these percentages and grade boundaries are fully customizable in our Grade Curve Calculator using the Custom Normal Distribution or Grade Boundaries features. You can adjust them to match your institution's specific standards.
Which curving method on the Grade Curve Calculator is best?
The "best" method depends on your goal. Our calculator offers several options:
- Linear Adjustment & Flat Scale: Best for simple, uniform score shifts.
- Bell Curve: Best for standardizing results to a normal distribution.
- Square Root Curve: Best for helping lower-performing students significantly (e.g., 50 raw points $\rightarrow$ 71 adjusted points) while minimally affecting top scorers (e.g., 90 raw points $\rightarrow$ 95 adjusted points).
- Highest = 100%: Best for extremely difficult exams where the top student did not get a perfect score.
Does curving grades lower academic standards?
No. When used correctly, a grade curve does not lower standards; it corrects for assessment bias. It ensures that grades accurately reflect student understanding relative to the difficulty of the exam. Our tool helps you maintain standards by offering methods that lift grades uniformly without altering student rankings.
Is grading on a curve legal or allowed?
Grading on a curve is generally allowed, but it depends on school, college, or university policies. Some institutions permit curving freely, while others have strict grading guidelines that instructors must follow.
When should I use this Grade Curve Calculator?
You should use the calculator when exam scores are unusually low due to difficulty, when there is a wide disparity in results, or to standardize grades across different class sections. It is particularly useful for applying the Highest Score = 100% method or normalizing a distribution using the Custom Normal feature.